
Knowing which cost codes are performing well (or not) and why can help your company meet production goals—and ensure profitability.
Our newest enhancement, Production Insights Trends, helps you track, categorize, and compare your cost codes over time. That way, you know exactly how to keep projects on schedule and on budget.
See and improve your productivity in real time.
Historically, keeping tabs on efficiency rates has been an extremely manual process. Our Production Tracking feature makes it easy for field crews to log data from the jobsite. We took that one step further to give you deeper insight into what it all means.
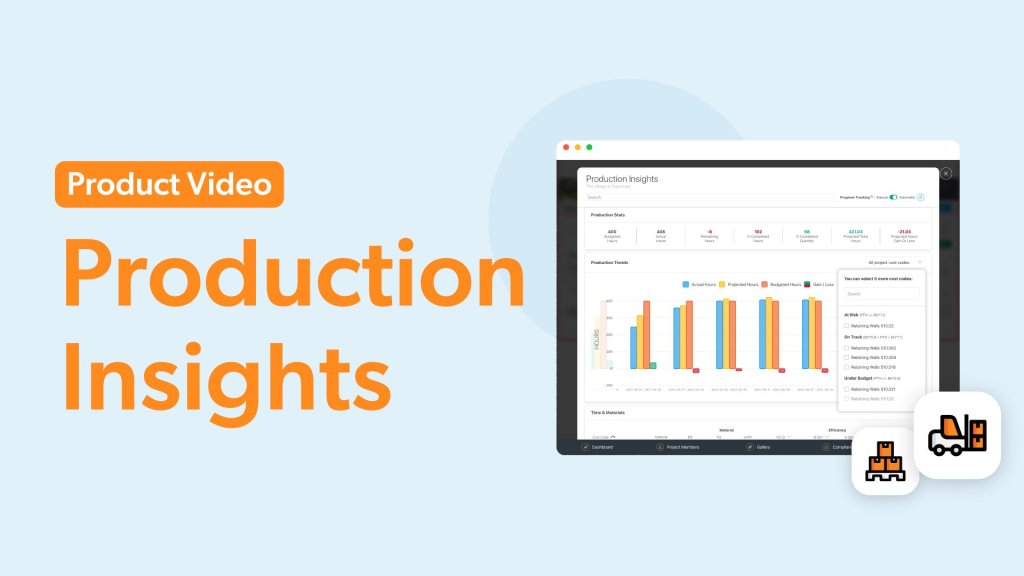
Production Insights Trends visualizes your productivity in one place. With field data and the Trends chart updated in real time, you can quickly identify and address any problem areas.

Cost code labels give you quick updates on production.
In Raken, construction cost codes are automatically labeled and grouped into three categories:
At Risk
On Track
Under Budget
At Risk identifies a problem area. Actual hours are projected to be 110% of the budget or more.
On Track means a cost code is doing well overall. Actual hours are projected to be 90–110% of the budget. However, you should monitor this job to ensure crews stay on schedule.
Under Budget shows that a cost code is making great progress. Actual hours are projected to be 90% or less of the budget.
These easy-to-read cost code labels quickly update you on ongoing projects—making it easier (and faster) to improve productivity.
Compare cost codes with the Trends chart.
The Trends chart lets you analyze and compare your production data over time.
There are three different ways to view the Trends chart:
All Codes (default bar chart)
Single Code (bar chart)
Multi-Code (line chart)
The All Codes view shows all the project’s production data for each week. You can see the actual hours, budgeted hours, projected total hours, and projected gain/loss.
The Single Code view is similar to All Codes, but only shows production data for one cost code.
The Multi-Code view is where you can compare the projected gain/loss for each week—for up to five cost codes.

With new ways to see your crews’ efficiency trends, you can adjust resource allocation to keep everyone on track.
Already using Raken? This feature is available to our Pro and Performance plans. Get started with Production Trends Insights.
New to Raken? See how our Production Tracking features work.
Raken makes it easy to collect, analyze, and compare your production data. Because with better insights, you can make better projects.
To see it in action, schedule a demo with us today. Every demo comes with a free trial, too.